Geometry & Probability A Complete Guide to Real-World Applications with Pathyacram
“Your journey to a healthy lifestyle begins here.”
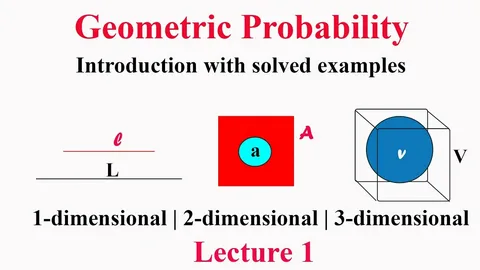
Understanding the Connection Between Geometry & Probability
Geometry and Probability may seem like two separate branches of mathematics, but together they create a powerful learning foundation that strengthens analytical thinking, visualization, and real-life problem-solving. At Pathyacram, we integrate these concepts deeply so students can connect shapes, measures, and logical outcomes with practical scenarios they encounter in academics and competitive exams.
This article explores how Geometry blends with Probability through Pie Charts, Graphs, Tables, Races and Games, Time–Distance–Speed, Thales’ Theorem, and Mixture problems, giving learners a well-rounded understanding.Geometry builds spatial understanding while Probability focuses on predicting the likelihood of events.
When combined, they help students analyze data, interpret patterns, and understand structured problem-solving. In Pathyacram’s curriculum, these topics are taught in a layered manner so learners can transition smoothly between geometric visualization and probabilistic reasoning.
Integrating Geometry and Probability for Smarter Problem-Solving with Pathyacram
Graph Based Problem Solving
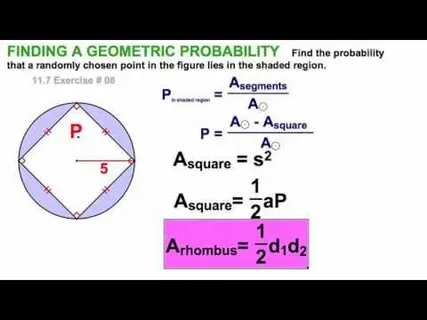
Pie Chart Interpretation in Geometry & Probability
Pie Charts are circular geometric diagrams divided into proportional sectors that represent numerical data. In the context of Probability, Pie Charts help simplify complex data by showing how likely a part is compared to the whole.
Using Tables for Data Interpretation
Tables organize numerical information into rows and columns, making it easy to apply geometric and probabilistic concepts. Students often convert tabular data into Pie Charts or Graphs a skill crucial for competitive exams. Pathyacram ensures that students develop strong table reading abilities so they can calculate ratios, percentages, and probabilities effortlessly.
Races and Games: Applying Geometry & Probability Together
Races and Games involve comparing speeds, distances, positions, and outcomes—making them an ideal blend of Geometry and Probability. Geometry helps determine paths, relative distances, and spatial orientation. Probability helps calculate the likelihood of winning, losing, or drawing based on given conditions.
Time, Distance, and Speed A Practical Extension of Geometry
Thales’ Theorem and Its Role in Structured Reasoning
Thales’ Theorem explains the proportional relationship between sides of triangles formed by parallel lines. Although geometric in nature, it indirectly strengthens probabilistic thinking by helping students understand proportionality, ratio, and logical deduction. Pathyacram integrates Thales’ Theorem into practical examples such as height-distance problems, map reading, and scaled diagrams, ensuring conceptual clarity for students.
Importance of Visual Tools in Geometry and Probability
Visual tools like Pie Charts, Graphs, and Tables play a major role in helping students connect geometric concepts with probabilistic reasoning. At Pathyacram, these visuals simplify complex data, making it easier for learners to interpret percentages, ratios, and trends. By converting raw data into diagrams, students build stronger analytical skills and understand how geometry helps break down probability-based scenarios.
Pathyacram uses this theorem to show how geometric relationships appear in real-life measurements such as building heights, map scales, and distance estimation. This deeper understanding strengthens logical thinking, which is also essential for probability-based reasoning.
Mixture Problems Connecting Ratio, Geometry & Probability
Mixture problems involve combining quantities in ratios—an approach rooted in proportional reasoning, similar to geometric similarity concepts. When calculating concentrations or combining elements, students often use probability concepts to predict outcomes or determine the likelihood of selecting a certain component. At Pathyacram, mixture problems are taught with clear visualizations, enabling students to link ratio, geometry, and probability seamlessly.
At Pathyacram, mixture concepts are taught through step-by-step visual illustrations, allowing learners to clearly understand how ratios, geometric relationships, and probability work together. This integrated approach helps students solve complex mixture problems with accuracy and confidence.
Conclusion
Geometry and Probability together form a comprehensive framework for logical thinking and real-world problem-solving. Whether interpreting Pie Charts, analyzing Graphs, reading Tables, solving Races and Games, calculating Time–Distance–Speed, applying Thales’ Theorem, or managing Mixture problems—the integration of these topics builds analytical strength and academic confidence. With Pathyacram’s advanced teaching structure, students gain a holistic understanding that enhances their performance in school exams, competitive tests, and everyday decision-making.
Frequently Asked Questions
1. How do Geometry and Probability connect in real-world problem solving?
Ans Geometry provides the structure for visualizing shapes, distances, and measurements, while Probability helps estimate the likelihood of outcomes. When combined, they help students interpret graphs, tables, and Pie Charts more accurately. Pathyacram strengthens this connection through practical examples that improve analytical and decision-making skills.
2. Why are Pie Charts, Graphs, and Tables important in learning probability?
AnsThese visual tools simplify complex numerical data and make patterns easier to understand. They help students convert raw figures into meaningful insights, improving their interpretation skills. At Pathyacram, learners use these visuals to calculate ratios, percentages, and probabilities with greater clarity.
3. How does Thales’ Theorem support logical reasoning?
Ans. Thales’ Theorem teaches students about proportional relationships and similarity, which are crucial in geometric reasoning. These ideas help students interpret heights, distances, and scaled diagrams effectively. Pathyacram integrates this theorem with practical applications so learners build strong logical and mathematical connections.
4. What skills do students develop through Races and Games problems?
Ans.Students learn to analyze relative speeds, distances, and outcomes using structured reasoning. These problems combine geometric understanding of paths with probabilistic prediction of results. Pathyacram ensures students master these questions by offering clear, logical steps suited for competitive exams.
5. How do Mixture problems relate to Geometry and Probability?
Ans Mixture problems rely on ratio and proportional reasoning, similar to geometric similarity concepts. Probability is used to determine concentrations or the chance of selecting a certain component from the mixture. Pathyacram explains these concepts with visual methods, helping students solve complex problems easily.